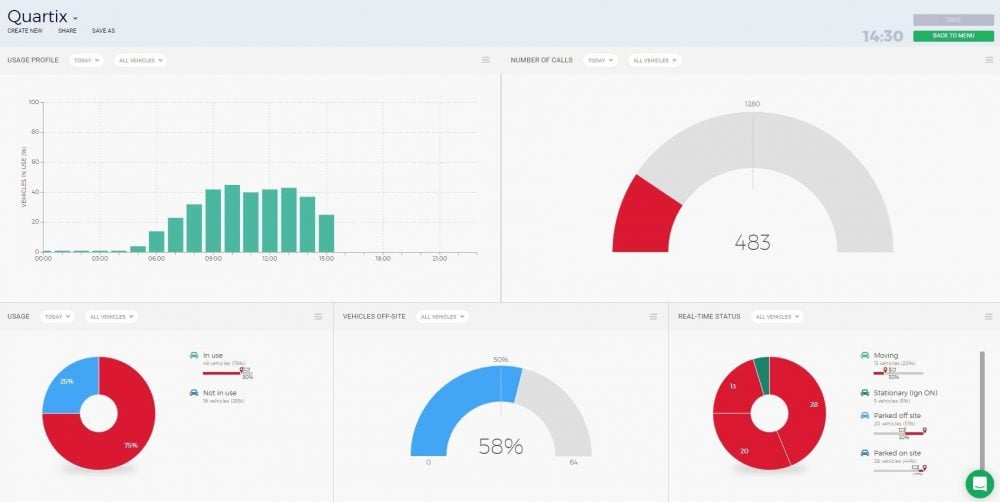
Could vehicle tracking dashboards make your fleet more productive?

May 6, 2020

Just like the console on a truck or van gives you vital information while you drive, operational dashboards provide you a live summary of data that your vehicle tracking system collects. This data is then displayed in charts and graphs that are easy to read and understand at a glance.

Quartix dashboards are a good choice for your business if your vehicle tracking data:

  • Needs to be reviewed immediately;
  • Is relevant to many employees or departments; or
  • Helps you achieve short and medium-term goals

Let’s consider these three points and analyze how vehicle tracking dashboards can work for you.

A real-time review from multiple sources

As a busy owner or fleet manager, you might not have time to monitor each of your vehicles all day long, but you need to know what they’re doing at any point during the day.

Quartix offers you several ways to monitor your fleet in real-time and the Real Time Status chart on the dashboard is one of them. Instead of keeping an eye on all your vehicles on a map, this chart shows you which vehicles are moving or stopped, and which drivers are idling, with just one glance. If there is a problem, you can click on the graph to view an individual vehicle and investigate further.

You can also see what percentage of your fleet is moving or stationary, to ensure productivity is at full capacity.  This valuable information makes the dashboard feature a simple tool for improving fleet productivity; it summarizes your fleet’s activity and presents it to you in one place.

Ensuring all departments have access to your tracking data

Vehicle tracking data can be useful for many different departments and managers in your business. When set up, dashboards can be viewed by unlimited users, so that everyone can view and utilize the data.

For example, with the Users graph and the Usage Profile, a fleet manager can see what time of day the fleet is most active, so they can design a staffing schedule. Meanwhile, a maintenance manager can use the same information to see when vehicles are not active and when is the best time for them to be serviced.

The Off-site chart shows which vehicles have left the location at which they ended the previous day—usually the depot or the driver’s home address—and are therefore are out working. This information allows the operations manager to see which vehicles are out on the road and need to be monitored, or allows an HR manager to see which drivers have not started their day by a certain time and need to be contacted.

Reaching your business goals

Data from vehicle tracking Dashboards can go a long way to helping your business meet short and medium-term goals such as a reaching a quota on daily deliveries or sales meetings. In this instance, Quartix’s Number of Calls graph can show you the number of stops, or calls, your drivers make each day.  You can even set up an alert that will tell you when your daily target isn’t met by a certain time of the day.

Whatever your goal is, you can use this aspect of the dashboard to ensure that enough stops are being made in line with your productivity objectives. Being able to set this graph up for individual teams or groups of vehicles gives you even greater visibility.

Dashboards are an instant snapshot of what is happening with your fleet at any moment of the day and allow all departments of your company to analyze and use your vehicle tracking data to increase your fleet’s productivity.

For more information on how to set up Quartix vehicle tracking Dashboards, download our Dashboards User Guide.

Try our demo

See for yourself how Quartix works with our fully interactive real-time demo.

Need to speak to one of our experts?

1-855-913-6663

1-855-913-6663

Ask us a question

Ask us a question

We’ll help you decide which vehicle tracking option is right for you