

People don’t drive anywhere near to the speed limit on most 60mph roads. We rely on our own judgement instead. In fact, the top speed for most rural 60mph roads is 34mph. Our analysis of millions of journeys proves that the majority feel 60mph is unsafe and adjust their speed accordingly, but what is in place to guide risk-takers?
“I was driving under the speed limit” It’s a questionable defence after a crash on a country road. Driving below the legal speed limit does not always mean you were driving at a speed safe for the road, and we’ll explain how our vehicle tracking data proves this.
The most dangerous road type
Rural roads are England’s deadliest. In 2022, they made up just 43% of traffic but accounted for 57% of all road deaths and 68% of car occupant deaths. One quarter of all fatal collisions involved drivers either exceeding the speed limit or going too fast for the conditions, while many other factors like “loss of control” or “careless, reckless or in a hurry” also link to inappropriate speed.
Whether under the speed limit or not, physics are unforgiving. Research shows that for every 1mph reduction in average speed; collision risk drops by 5%1. Survival chances in a head-on crash at 60mph are just 10%. But reduce the speed to 48mph, and the chance of survival rises to 50%2.
1Taylor, Lynam and Baruya, 2000, 2Richards and Cuerden, 2009
Why 60mph limits are misleading
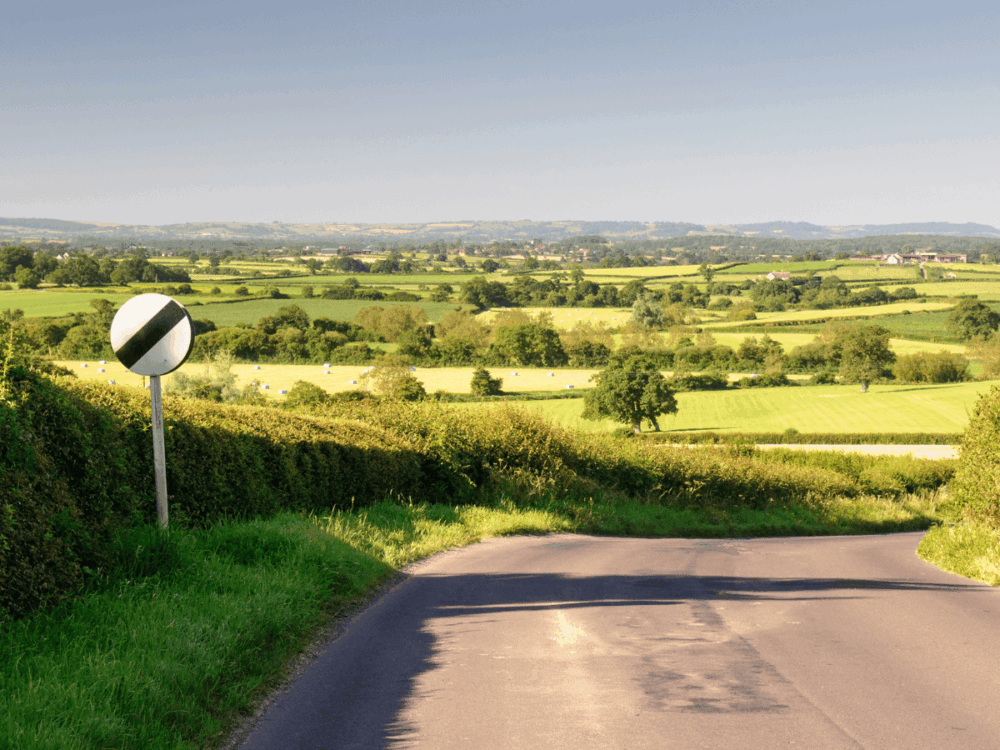
Single-carriageway roads outside built-up areas carry the 60mph national speed limit. But in reality, they rarely allow for safe travel anywhere near that speed. Long straights invite rapid acceleration but can lead to unexpected blind bends. Surfaces are often poor. Visibility is limited. Add tractors, cyclists, and scarce safe overtaking opportunities, and the result is a road network with lethal risks.
In this article, we explore what an appropriate speed looks like on the UK’s single carriageways, backed by real data.
How are speed limits set?
Speed limits are set nationally under the Road Traffic Regulation Act 1984: 30mph in built-up areas, 60mph on single carriageways, and 70mph on dual carriageways and motorways. Local authorities can lower limits through Traffic Regulation Orders, but only after lengthy consultations and evidence-gathering. (Note: the speed limit appraisal tool can help with this process).
The Department for Transport advises against varying speed limits too frequently along a route and warns they should not be used to solve “isolated hazards” like junctions or sharp bends. So this is a good example of where judgement comes into play.
Nevertheless, speed limits are intended to guide road users and indicate the nature and risks of the road.
The difference with rural roads is recognised
Most country lanes carry the same 60mph limit, whether they’re wide, straight, narrow, or winding. But drivers must choose a safe speed on these roads that often vary mile by mile.
Government reports show that on many of these roads, especially C and unclassified routes, most people travel well below the limit because of their layout. And with good reason:
Did you know? Assessments by the Road Safety Foundation (RSF) show that most single carriageway roads on the strategic road network score just 1 or 2 stars on an international 5-star safety scale. The score is based on frequency of death and serious injury, and the likelihood of collisions in relation to the amount of traffic on the road. In plain terms, the star rating shows these are high-risk roads with little protection in the event of a crash.
We were keen to investigate how far below the speed limit people actually drive on these roads. Jump to the findings.
What motivates us to comply with speed limits?
Why do we drive the way we do? The speed limit looks like a rule to follow but our choices behind the wheel are far more complex. We make constant judgements – balancing safety, risk, convenience, and social pressure. Do we hold our nerve at 45mph when someone looms in the rear-view mirror, or do we speed up to avoid becoming an obstacle?
Research suggests drivers respect lower speed limits most when the road itself “tells the same story” – for example, outside schools, through villages, or on shopping streets. We’re more likely to comply when the hazards are obvious. But rural single carriageways send a mixed message: a national limit of 60mph on roads that often feel hazardous.
What happens when our instinct differs wildly from the speed limit? On these 60mph rural roads, there’s little concern for the penalties of exceeding the speed limit – but could the signs push us to go faster than we otherwise would?
Our tracking data makes it clear that even if the speed limit tells us that it’s reasonable to go fast, our judgement overrides. On nearly all rural 60mph roads, drivers do not treat the limit as a target. Instead, their collective behaviour tells a very different story.
What the data reveals: Tracking traffic on 60mph roads
Our analysis of millions of journeys on over 1.8 million segments of UK 60mph single carriageways shows that people don’t reach the speed limit on most of these roads.
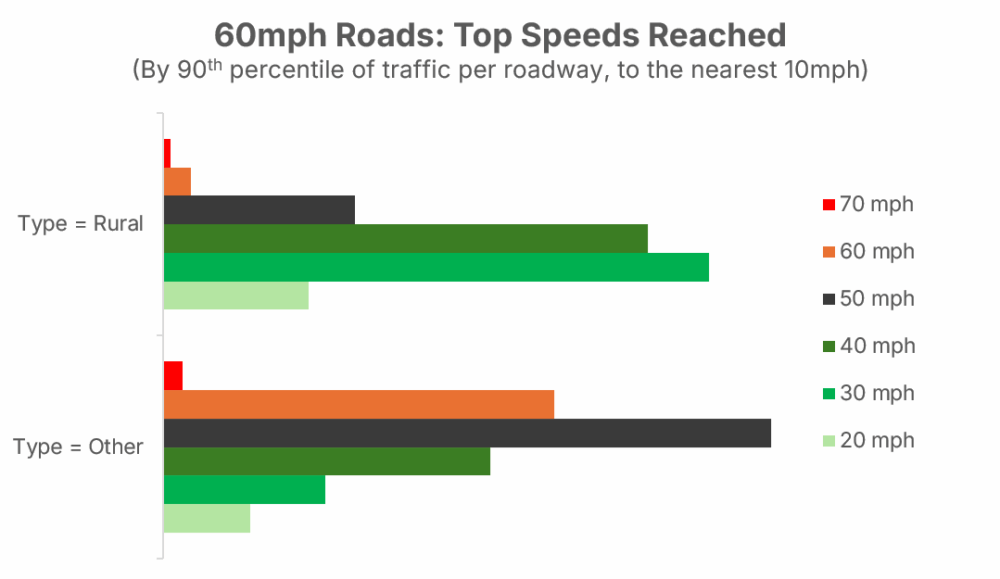
Across all 60mph single carriageways analysed:
- only 15% of these roadways showed a top speed* above 54mph
- less than 50% showed a top speed* above 44mph
And, most astonishingly:
- 34mph is the top speed* recorded on the majority of rural 60mph roads.
Drivers reach 60mph on less than 2% of these rural road types and, our data showed 20mph is five timesmore prevalent as a top speed than 60mph.
*Top speeds: This is displayed as the speed below which 90% of tracked vehicles travelled. To ensure meaningful results, only roadways with significant levels of traffic in our telematics database were included in the results – the threshold for significant traffic was set at 100+ speed datapoints recorded over the last year.
In this analysis, “roadway” refers to the individual stretches of road defined in OpenStreetMap (OSM). We categorised ‘rural’ 60mph roads using OSM filters: tertiary or unclassified, single carriageway, two-way, and unlit.
Below is a breakdown of 60mph roadways that fall into each top-speed bracket. We define this speed (representing the upper limit that 90% drivers consider safe for each roadway) as the ‘SafeSpeed’.
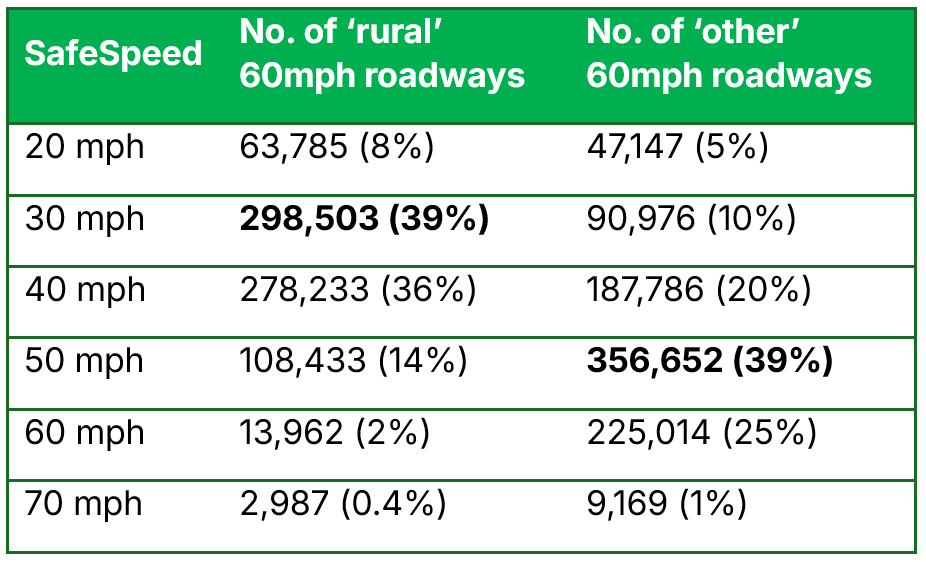
Note: The SafeSpeed is rounded to the nearest 10mph. For example, a roadway with a SafeSpeed of 30mph indicates that 90% of vehicles recorded top speeds between 25-34mph here. Since our telematics system captures speeds every 30 seconds, this offers a reliable view of overall traffic flow.
‘Rural’ vs ‘other’ 60mph roads
Examining other 60mph roads, less disparity shows between the speed limit and the speed people actually travel. However, the results still suggest 60mph is too fast – on most of these roads people travel at or below 50mph. Roughly the same number have traffic peaking at 40mph as those at the full 60mph limit.
In contrast to motorways and 30mph roads where speeding is a common issue, despite the deterrent of cameras and penalties, only 1% of these 60mph roads see people exceeding the limit.
The results make it clear that we drive very differently on rural roads, where the 60mph speed limit is seen as critically unsafe. On less rural 60mph routes, drivers are comfortable going closer to the limit. Most of us instinctively adjust our speed – but without clear guidance, how can we discourage the risk-takers who don’t?
Quartix relative speed scores: A better measure of safety
On 60mph roads, drivers rarely treat the speed limit as a target – instead, they naturally drive well below it. But the outliers matter: that top 10% still push far beyond what’s safe.
The SafeSpeed database powers our telematics driver behaviour scores by providing a relative speed score – a measure of how far a driver’s speed deviates from the SafeSpeed for the roads they use. A higher score indicates greater risk, if the driver is regularly travelling above the safe threshold. Crucially, this highlights risks that would be invisible if we looked only at compliance with the posted speed limit.
Mark Cartwright, Head of Commercial Vehicle Incident Prevention at National Highways, highlighted the critical role of proactive safety management for mobile teams: “I think the kind of rich data that businesses can pull from systems such as Quartix is invaluable. I’ve always liked Quartix’s SafeSpeed feature. We know that speed is a significant cause of collisions and certainly makes them more serious”.
Learn more about the Quartix vehicle tracking system and how our driver behaviour scores can help you manage risk in your organisation or arrange a product demo with one of our experts.
Need to speak to one of our experts?


We’ll help you decide which vehicle tracking option is right for you