


Is your fleet ready for EVs? Let your data answer the question
A hands-on EV-readiness check for your fleet: see which vehicles can switch using data you already have, then get maximum range from every EV you run.
A hands-on EV-readiness check for your fleet: see which vehicles can switch using data you already have, then get maximum range from every EV you run.
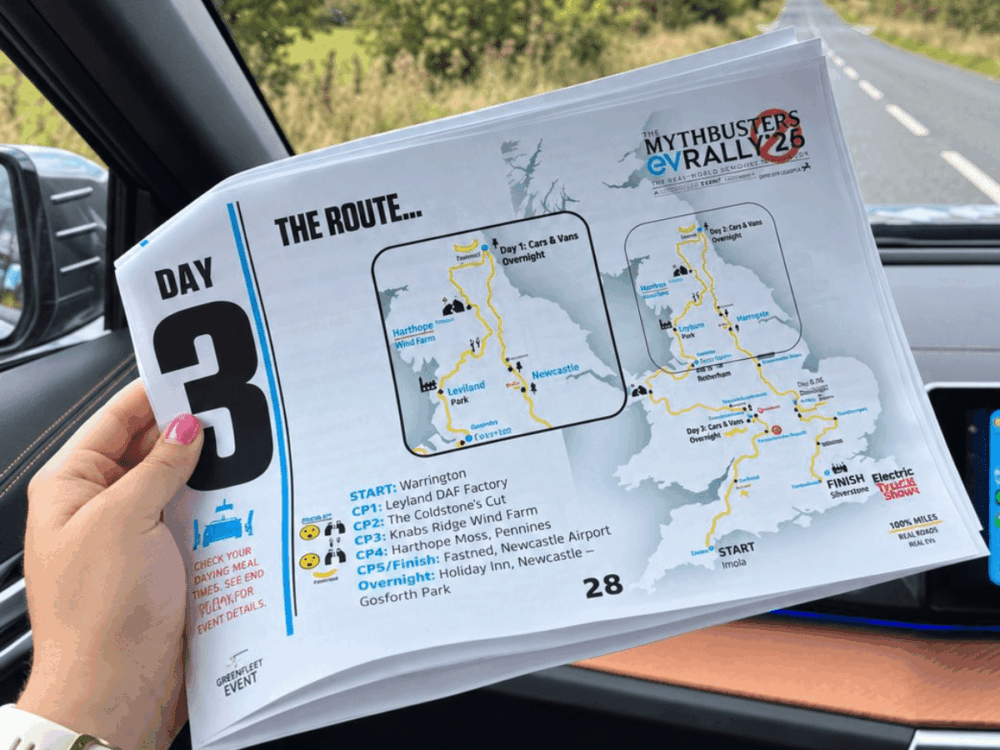
The Greenfleet 2026 EV Rally busted a lot of myths around EVs. Over five days and more than 1,000 miles from Exeter to London, electric cars, vans and trucks did the job in real working conditions. Quartix was there as Official Technology Partner — measuring every vehicle across the route, and driving it alongside the teams. If you missed the results, they’re here.
But “EVs work” and “EVs work for my fleet” are two very different statements. The first is now hard to dispute. The second is a question only your own operation can answer — and the answer is already sitting in the data you collect every day.
This guide is the practical companion to that decision: how to assess EV readiness from the mileage, utilisation, location and driving data your vehicle tracking system already gathers — and how to get the most range from every EV once it’s on the road.
Some of the doubts that hold fleets back were tackled head-on at the EV Rally, with the people who know the subject best:
See the full recap here.
The questions that remain are more practical, and more personal to your operation:
These aren’t myths to bust. They’re facts to check. And every one of them can be answered from data you already have.
Range anxiety is usually a fear of the unknown, but your fleet’s daily mileage can help build the picture. Trip and mileage reports show how far each vehicle really travels on a typical day, week and month. Set those distances against the usable range of the EVs you’re considering. A van on a predictable 16-mile-a-day round is an obvious early candidate; a high-mileage motorway vehicle needs a closer look. Either way, you’re matching real distances to real range.
Public charging infrastructure may be widely available near your routes, but you want to know whether your vehicles can charge where they already stop. Live tracking and location history show where each vehicle ends its shift and how long it sits there. A vehicle that returns to the same depot or a team member’s home and stays put overnight can rely on slower, cheaper charging; one that rarely stops for long, or parks away from power, can be flagged at the planning stage. This points you to where charging needs attention rather than sizing the network for you.
This is where fleets save the most money and it starts with a warning: don’t replace your fleet one-for-one.
The most expensive EV mistake is buying electric versions of vehicles you didn’t really need. Use utilisation data to find the vehicles that are barely working, right-size first — cut or reallocate the under-used ones — and only then electrify what you really need. The result is a smaller, cheaper, better-matched order.
Your vehicle utilisation report makes the under-performers obvious at a glance. An example report might read like this:
| Vehicle | Monthly distance | Idling | What it tells you |
| Sprinter van | ~480 miles | 7% | Low mileage — an easy early EV win |
| Transit van | ~1,420 miles | 14% | Viable, but check the route pattern |
| Combo cargo | ~2,150 miles | 15% | High use and high idling — plan carefully |
The dashboard’s usage charts make the same point visually, used versus unused vehicles each day, with the unused group listing the vehicles to reallocate first, not electrify.
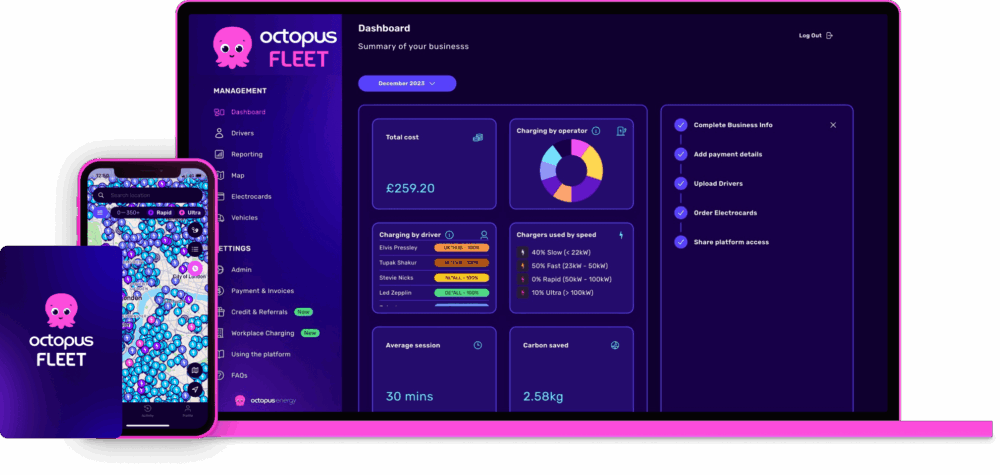
Right-sizing is also the biggest single lever in the financial case: fewer vehicles bought outweighs any running-cost difference. Build the rest on your real diesel baseline — the mileage and fuel data your vehicle tracking system already records — against EV running costs. Our ROI calculator and fuel savings calculator turn those numbers into a payback picture you can take to your finance team. Reach out to our partners at Octopus Fleet if you would like help to plan and manage your EV transition.
Work through the four checks and you’ll have an evidence-based answer. Use this as a quick scorecard:
| Check | You’re ready when… | Where the data lives |
| Range | Each candidate vehicle’s daily mileage fits comfortably within EV range | Trip and mileage reports |
| Charging | Candidate vehicles stop somewhere with power for long enough to charge | Live tracking and location history |
| Right-sizing | Under-used vehicles are cut or reallocated before any EV order | Utilisation report and usage charts |
| Cost | Your diesel baseline shows a workable payback against EV running costs | ROI and fuel savings calculators |
Want the strategy behind the sequence — which vehicles, in what order, and how the shifting regulatory picture affects your timing? Read The Pragmatic Path to an Electric Vehicle Fleet.
Passing these readiness checks tells you which vehicles can go electric. Getting the most from them afterwards is a separate, ongoing job. A lot of EV range is set by how a vehicle is driven and routed — the same data that we safety-scored every vehicle at the 2026 EV Rally.
Safer driving and better range pull in the same direction: a better driving style helps both. We believe safety and sustainability go hand in hand, a view we put forward at this year’s UK Fleet Champions Awards 2026.
Harsh acceleration and heavy braking drain an EV faster than almost anything else. Driver behaviour monitoring scores acceleration and braking second by second. Managers can click any harsh event to see exactly where it happened, so coaching is about a real moment on a real road instead of a vague instruction to “drive better.” Smoother deceleration also lets regenerative braking recover more energy, feeding range back into the EV battery.
Aerodynamic drag rises sharply with speed, so motorway habits have an outsized effect on how far an EV will go. Our unique SafeSpeed database scores each vehicle’s speed against the speed of other road users on the same stretch of road, regardless of the speed limit – giving a relative score. That not only gives a better measure of risk, but also makes it easy to spot where easing off the accelerator would stretch range, without slowing the working day.
An EV doesn’t idle an engine, but leaving it switched on and stationary still drains the traction battery to run heating, cooling and onboard systems. Idling reports surface that waste, and smarter routing through fleet management tools trims unnecessary miles. The mile you never drive uses no energy at all.
Insight only changes range if the people behind the wheel act on it, which is why the scores are built to engage rather than just report. Our colour-coded daily driver league table turns smoother driving into friendly competition, while each team member sees their own performance in the Quartix mobile app and can adjust naturally. It’s an approach customers see working for themselves:
“In the first months of using Quartix, we had no drivers with green (good) scores. We started publicising the results, and we were inundated with questions from them about how to improve. They paid attention and wanted to turn things around.
Now, they are all competing for the top position – it’s always very tight each month, with most drivers scoring between 95-99. The driver behaviour reports have saved us £160,000. A 12% improvement in MPG and reduced CO2 emissions, plus fewer vehicle breakdowns and far less workshop hours… Results like these are precisely why we use telematics”

The mileage, utilisation, location and behaviour data you already collect can answer the EV readiness question vehicle by vehicle — and then help you get the most range from every EV you add. It works just as well mid-transition, or across a mixed fleet, as it does for a fully electric operation with vehicles due for replacement.
Quartix has turned fleet data into clear decisions for 25 years. It holds the London Stock Exchange Green Economy Mark, and was named Fleet News Recommended 2025 and 2026, and What Van? Telematics Supplier of the Year 2026.
See what your fleet data could reveal: speak to one of our team to book a demo, and explore our customer case studies.

We’ll help you decide which vehicle tracking option is right for you


Top-rated fleet tracking, zero setup fees. Limited time offer for new customers.
Get the discount
