How does vehicle tracking calculate and use driver scores?
The data collected by a vehicle tracking system is a rich source of information on driver behaviour. We explain how Quartix driving scores are calculated and how they can help.


The data collected by a vehicle tracking system is a rich source of information on driver behaviour. We explain how Quartix driving scores are calculated and how they can help.
Every fleet manager, no matter the size of their fleet, is concerned with improving driver performance. Whether it’s to mitigate the risk of accident or reduce fuel costs, it has become the standard for fleets to monitor and correct driving behaviours. The data collected by a vehicle tracking system is a rich source of information on a driver’s personal performance.
Quartix provides an easy-to-understand, colour-coded score for each vehicle or driver in a fleet. This score features prominently in Quartix’s driving style reports as a way for fleet managers to instantly recognise which drivers need to improve their skills.
This score is calculated by looking at two important areas of driver performance.

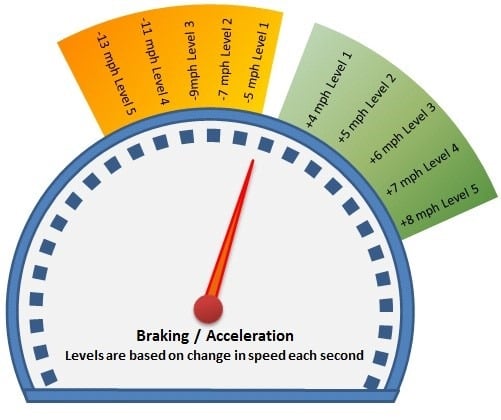
The Quartix system monitors the speed of a vehicle every second. The system then calculates:
This calculation becomes the acceleration index and the braking index.
Acceleration index: the sum of all the acceleration incidents, each multiplied by their severity and finally divided by the driving time in hours. Calculating it in this way means that no drivers are penalised for driving more or less than any other driver.
Braking index: the sum of all braking incidents, worked out in a similar way, except that the levels of speed change are slightly different, as are the severity weightings, as excessive braking is considered to be more of a risk factor.
The speedometer pictured here shows the 10 levels of acceleration and braking, each level has a weighting based on its severity. For example, if the speed increases by 6 mph in a second, that is a level 3 acceleration. If the speed decreases by 9 mph, that is a level 3 braking, and so on.
To get the driving style score, the Quartix system:
This is the driving style score.
For example, if you have a driver with an acceleration index of 10 and a braking index of 6, the average for this driver would be 8. This drivers’ driving score would be 100 minus 8, equalling a score of 92.
Our system calculates the driver score each day based on the amount of driving for that day or shift. We apply colours to the scores, as well, for easy identification.
GREEN: Scores greater than 80, represent the best 30% of drivers
AMBER: Scores of 50-80, represent the middle 50% of scores
RED: 50 and below, represent the worst 20%

Quartix recognises that the speed of a vehicle is important and exceeding the speed limit is a major factor in accidents and road incidents. But evaluating driving behaviour by just using the legal speed limit isn’t the best way. Often, the safe speed for a road may be well below the legal limit.
This is particularly true on rural roads where data shows a surprisingly high rate of fatal accidents despite very few drivers exceeding the legal limit on such roads. With a better picture of the average speed drivers use versus the ‘legal’ speed, fleet managers can coach drivers on safer driving, potentially saving lives and reducing loss ratios.
By measuring the speed of many thousands of vehicles over a long period, Quartix has designed the SafeSpeed database, made up of actual speeds recorded at several million locations across the country. This means that the speed of any vehicle, at any location can be compared to the speed of other vehicles that have travelled on the same section of road.
To learn more about the SafeSpeed database, download our free whitepaper or watch our video.
Quartix provides a Relative Speed Score for each driver and vehicle which uses contextual speed to giver a better picture of the driver’s performance. However, this score is separate from the driving style score.

“When we first started using the Quartix driving style tables and sending them out to the managers, it immediately started an improvement in driving style, less harsh breaking or acceleration.”
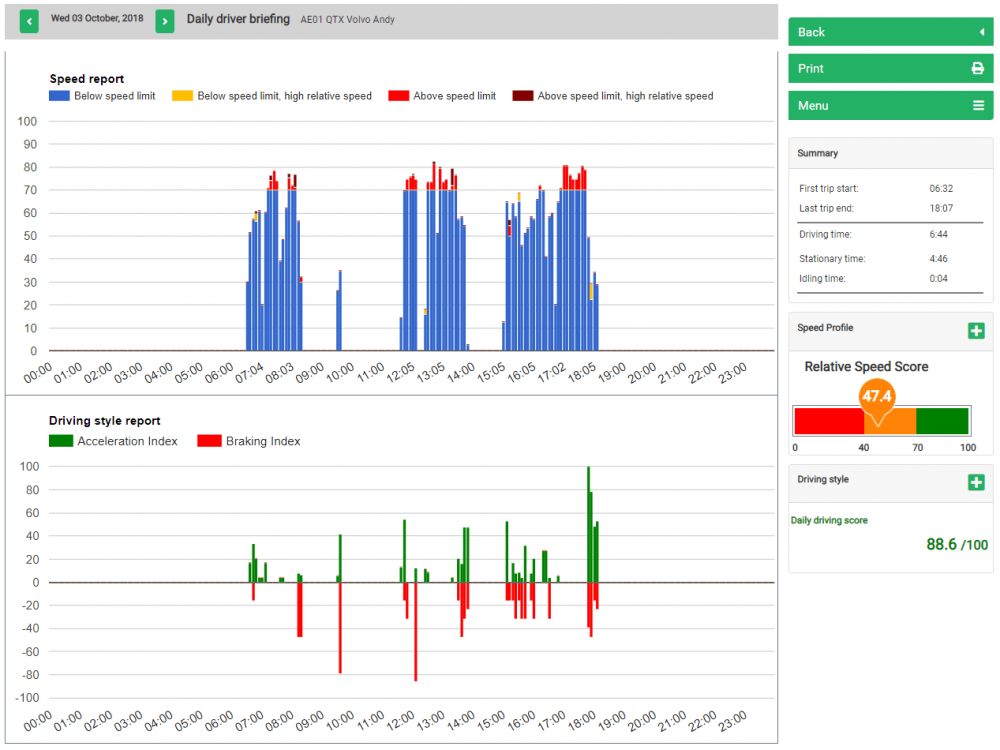
The best place to see an individual vehicle or driver’s performance is the daily driver briefing, a report that summarises both the speed and driving style scores for the day, as well as driving and idling times. It’s a complete picture of the day’s driving performance, with the ability to click and view on a map any instances of high speed or harsh braking/acceleration.
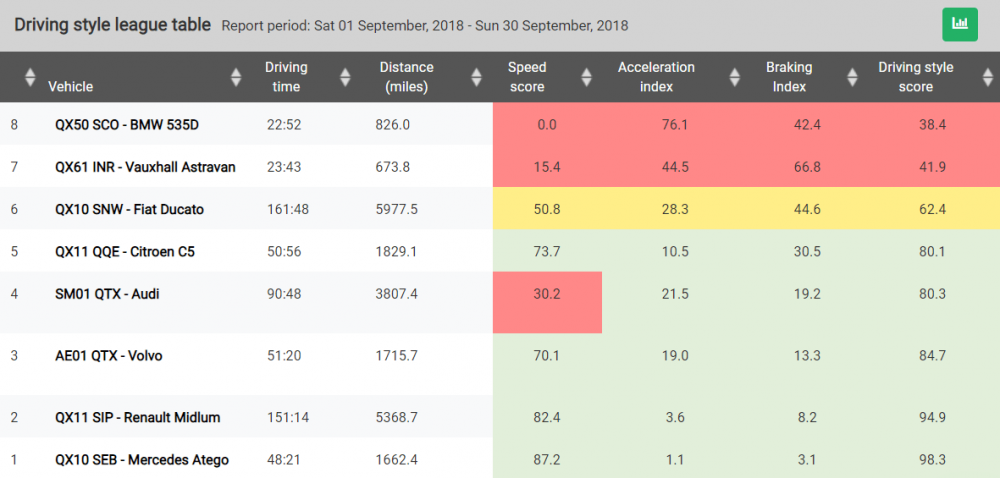
For comparing vehicles and drivers across a fleet, the driving style league table is a valuable tool that allows a fleet manager to easily spot drivers with low speed and driving style scores. Many businesses find this helpful to motivate their drivers into improving their driving performance.
“With the driving style monitoring suite, we are able to identify problematic drivers and issues which need addressing. For the past 12 months, we have been incentivising good driving by giving our drivers a retrospective bonus based on the data provided by the Quartix system.” – Darren Hammond, Director, C and D Southwest.
Additionally, our fuel-efficient driving tips infographic can be handed to drivers, to help encourage more economical driving behaviours.
Driving Style Scores are a way to clearly identify driving behaviours that should be corrected, making it easier to effect changes in line with specific goals, like reducing costs and increasing road safety. It won’t happen overnight, but the benefits far outweigh the effort involved in laying the foundations for change.
“We’ve seen around a 20% improvement in driving style across the fleet. Since using Quartix, our drivers are now in the 80-100 driving score range, which is where we wanted to be. We’re doing daily briefings with the drivers and they can easily see how their driving style has improved. Our drivers have faith in the Quartix tracking system. The driving style performance data makes sense to them and we’ve seen dramatic improvements in their scores as a result.” – Karl Davidson, Depot and Transport Manager, St. Austell Brewery
For examples of how Quartix clients have used vehicle tracking and Driving Style Reports, read more of our case studies.
We’ll help you decide which vehicle tracking option is right for you
Top-rated fleet tracking, zero setup fees. Limited time offer for new customers.
Get the discount